
Analysis of the 2020 Medicare Advantage Annual Enrollment Period (AEP) Results
Medicare Advantage (MA) continues to be an attractive market with continually expanding membership and increasing investment by MA organizations (MAOs) to capture market share.
Now that the dust has settled post-Annual Enrollment Period (AEP), and CMS has released February monthly membership enrollment data, we have granular insight into the shifts in membership resulting from 2020 AEP.
2020 AEP trends
As MAOs set strategies for 2021 product design and beyond, understanding the 2020 AEP trends and anticipating competitive activity will be critical to capturing, maintaining and growing market position.
To help MAOs do this, Pareto Intelligence quickly ingested the February CMS data and developed the following dynamic analysis, leveraging our Pareto Spotlight solution, to gain insight into the national and regional trends shaping the MA market. Knowing that membership acquisition is a year-round endeavor, you can use the filters to toggle between "January 2019 –> February 2020" and "December 2019 –> February 2020" throughout the analysis to understand year-over-year (YoY) trends versus AEP-specific results.
Below are some of the key takeaways from the 2020 AEP data:
Product Trends
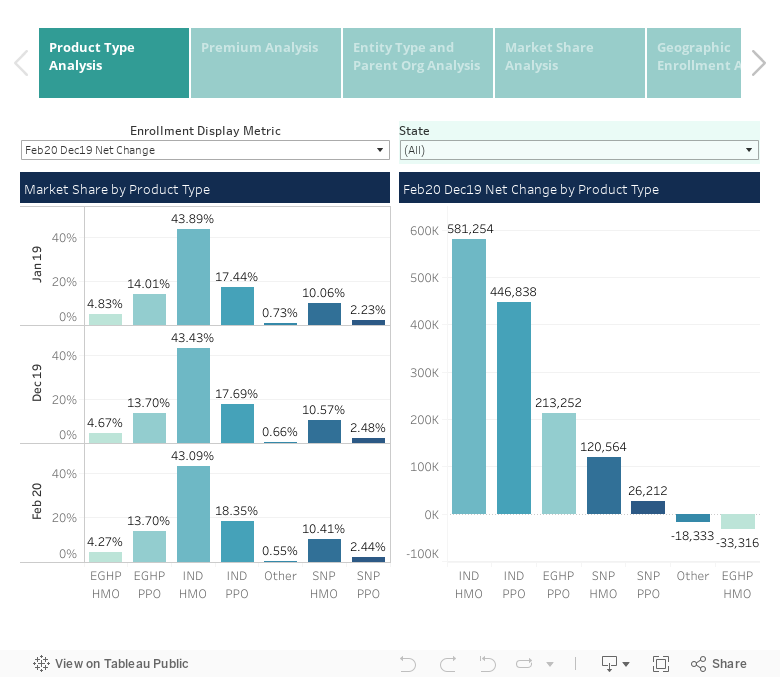
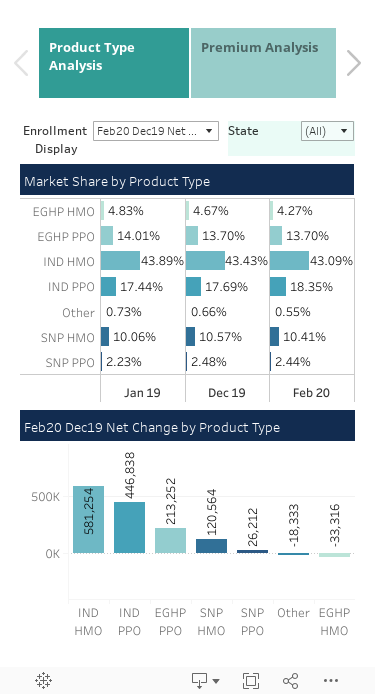
- Individual PPOs: In 2020, we saw Aetna separating from the market by launching an Individual PPO at $0, resulting in significant market share gain. This trend continues into 2020 with a 10.25% growth in Individual PPO membership from AEP.
- Individual HMOs: On a total member basis, Individual HMO continues to be the most popular product with over 11 million members and a gain of 580k+ memebrs from AEP.
- Continued popularity of $0 premium products: Over 50% of Individual HMO/PPO products in the market have a combined Part C & D premium of $0, which significantly outpaces 2019 metrics where only 35% of PBPs were $0.
- SNPs: We continue to see significant YoY growth with SNP PPOs and HMOs membership increasing by 21.3% and 14.75%, respectively. SNP remains a small portion of the overall market, totaling 3.3M lives, but it is drawing major attention and focus from both National and Regional MAOs.
Trends by MAO Entity Type
- Nationals continue to capture membership and market share. The top three growing MAOs over the last 14 months as well as from AEP are the same: United, Humana and Aetna. Cigna increased membership the most, growing 13.42% through AEP. The Nationals lead the Blues, Provider-Sponsored and Regional plans with a 6.348% growth rate.
- Blues experienced moderate growth. Nearly every Blue experienced some growth, with established, larger Blues gaining measurable membership through AEP:
- Blue Cross Blue Shield of Michigan (12.1%)
- Cambia Health Solutions (9.7%)
- Triple-S (6.1%)
- Highmark (6.0%)
- BlueCross BlueShield of Tennessee (5.1%)
- Blue Cross and Blue Shield of Alabama (-15.6%), Blue Cross Blue Shield of Arizona (-9.9%), and Health Care Service Corporation (-1.0%) were the only Blues to experience a loss in membership from AEP.
- New MAOs see growth through AEP. Companies like Devoted Health, Bright Health and Clover Health drew significant market attention and membership growth as a result of YoY expansion strategies.
- Devoted Health: Nearly tripled in size, expanding to 16k members from 4.3k.
- Bright: 36% increase in membership—from 3.8k to over 5k.
- Clover: 28.7% growth through AEP, increasing membership from 42k to 54k.
Supplemental Benefits
Initial observations into growth and prevalence for supplemental benefits in 2020 have shown interesting results. In addition to this update, Pareto released a deep dive analysis on MA supplemental benefits. Here are some of the highlights:
- Over-the-Counter (OTC): OTC continues to be a popular benefit amongst MA beneficiaries, with the majority of members now receiving the benefit. In analyzing retained products from 2019 to 2020 (that is, plans that offered an OTC benefit in both 2019 and 2020), some interesting trends appear:
- Plan Benefit Packages (PBPs) with an OTC benefit grew 7.26% from AEP, while those without an OTC benefit decreased membership by 1.68%.
- Plans with a richer OTC benefit experienced larger growth. The majority of the market offers <$200 annualized OTC benefit—those plans grew at 0.43%. Those plans offering a $200-$300 benefit grew at 7.49%, and PBPs with a $300+ benefit grew at 12.01%.
- For another interesting finding, PBPs that increased an OTC benefit allowance captured more membership (7.5% growth) than those who decreased OTC benefit allowance (3.967% growth), demonstrating that a higher annualized OTC benefit could be a way for MAOs to increase market share.
- Comprehensive Dental: Comprehensive Dental is also increasing in popularity as a supplemental benefit offering and is becoming a competitive product differentiator for MAOs.
- PBPs offering the comprehensive dental benefit in 2020 grew 4.87%, while those that did not grew 1.93%.
- Over 500k MA beneficiaries gained the benefit during 2020 AEP, and over 1M gained the benefit during the past 12 months. This significantly outpaces 2019 growth of 300K and 760K, respectively.
Current Pareto Spotlight subscribers can log in and pull further insights from the 2020 AEP results, including county-level and product feature-level results. If you are not a subscriber, contact us to learn more.