
First Look at the 2020 Medicare Advantage Competitive Landscape
Earlier this month, the Centers for Medicare and Medicaid Services (CMS) released the 2020 Medicare Advantage (MA) Landscape Files and PBP Benefits Data, providing insight into detailed product information and benefit designs for plan benefit packages (PBPs) down to the county level. With the MA Annual Enrollment Period (AEP) in full swing, plans are seeing the early results of their 2020 product placement and benefit decisions. In analyzing the 2020 product details, there are many new and continuing trends as the MA market continues to see more entrants and greater competition.
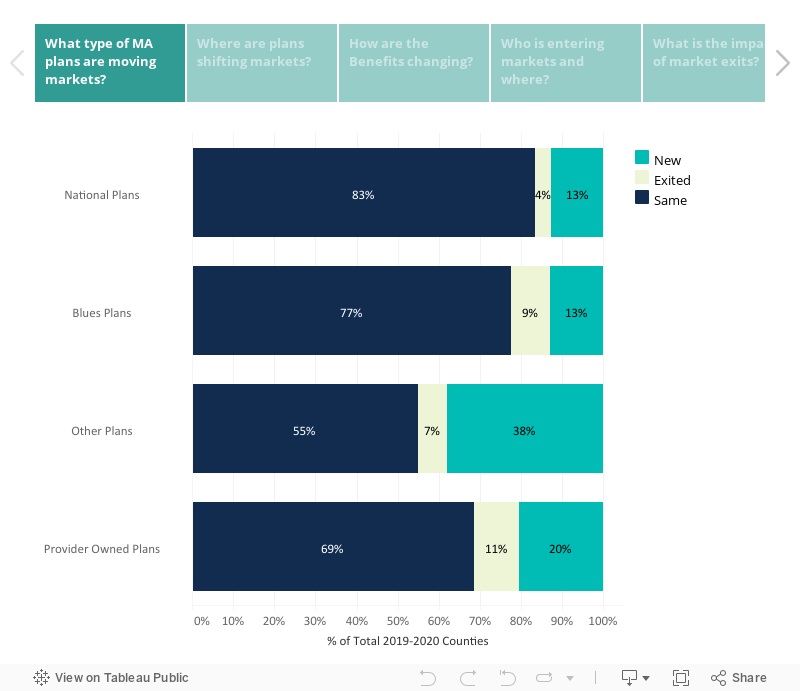
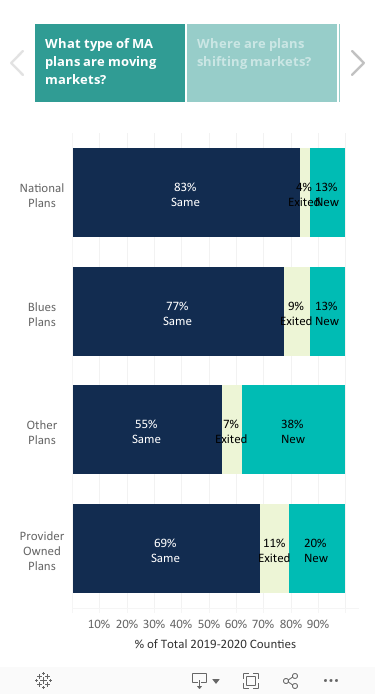
The dashboard below provides an interactive analysis of the MA competitive landscape to explore shifts that occurred at a state, national and plan type (e.g., Nationals, Blues, Provider-Owned) level.
(Note: All analyses and insights outlined are limited to Individual, non-SNP, non-PDP products.)
Key Insights for Medicare Advantage Organizations
- The Nationals continue to expand. In addition to adding new products and expanding PPO offerings in current service areas, National plans are entering new counties nationwide. This brings added competition to the Blues, Provider-Owned and Regional players. Building upon last years significant increase in market share, Aetna is entering 285 new counties, many within states in which they already are competing.
- Premium competition continues to heighten. Across all types of Medicare Advantage Organizations (MAOs), beneficiaries will experience lower average premiums in the market. In the Individual MA market (HMO/PPO), 43% of all products have a $0 consolidated Part C and D premium. The Nationals are driving premium competition with 52% of all products being at $0, including significantly higher percentages of $0 premiums in more competitive markets like Florida (90%) and Texas (78%).
- Opportunity for market capture in certain states with MAO exits. Maryland, Louisiana, Illinois, Iowa and Georgia have the highest percentage of 2019 members who are losing a product option from their current MAO (i.e., the plan is completely exiting the county in 2020). Many of the exits are led by the Nationals, specifically Humana who is exiting 45 counties but entering 128 new counties as they strategically reposition in select geographies.
- Dental, vision and hearing supplemental benefits are becoming table stakes. On average, nationally, over 80% of products include dental, vision and hearing benefits like eye exams, preventive dental, and eyewear. Over 85% of National and Blue products includes these benefits, while Provider-Owned Plans deviate from the national average with just over 70% of their products offering the same benefit types.
- The Nationals continue to lead in emerging supplemental benefits. Supplemental benefits continue to be a lever MAOs pull to differentiate their products to attract members, better serve their population and manage cost. In looking at a few expanding supplemental benefits, the Nationals continue to outpace the market, though there is a wide disparity in strategy within each plan type (e.g., Nationals versus Blues versus Provider-Owned).
- Over-the-Counter (OTC): 80% of Nationals, 50% of Blues and 47% of Provider-Owned Plan products carry the benefit.
- Among the larger Blues, there are various levels of OTC adoption:
- High Adoption: Blue Cross NC (100%), BlueCrossMN (75%)
- Medium Adoption: Blue Cross Blue Shield of Michigan (55%), Florida Blue (50%)
- Low Adoption: Health Care Service Corporation (25%), Blue Cross Blue Shield of Massachusetts (0%), Excellus BlueCross BlueShield (0%)
- Among the larger Blues, there are various levels of OTC adoption:
- Meal Benefit: 64% of Nationals, 22% of Blues and 28% of Provider-Owned Plan products carry the benefit.
- 95% of Cigna and 94% of Humana products include the benefit, while only 15% of United products do.
- Transportation Services: 46% of Nationals, 32% of Blues and 28% of Provider-Owned Plan products carry the benefit.
- Anthem, Cigna and Molina all have transportation services included in over 70% of their products, with Aetna and Kaiser being at 19% and 29%, respectively.
- Over-the-Counter (OTC): 80% of Nationals, 50% of Blues and 47% of Provider-Owned Plan products carry the benefit.
Pareto Intelligence’s MA market intelligence solution, Pareto Spotlight, was used to generate the above interactive analysis and insights. Pareto Spotlight subscribers have immediate access to this data, as well as regional and county-level benefit information and insights. To become a Spotlight subscriber, please contact us.