
Explore the 2021 ACA Risk Adjustment Transfer Payment Results
On June 30, 2022, the Department of Health and Human Services (HHS) released the Summary Report on Risk Adjustment Transfer for the 2020 Benefit Year, which outlines risk adjustment transfer payments by issuer and state for the Affordable Care Act (ACA) market. To help health plans understand the results, Pareto has quickly ingested the data and developed the interactive analysis below with year-over-year (YOY) comparisons into state average metrics (including average monthly premium), issuer transfer payments and high-cost risk pool payments.
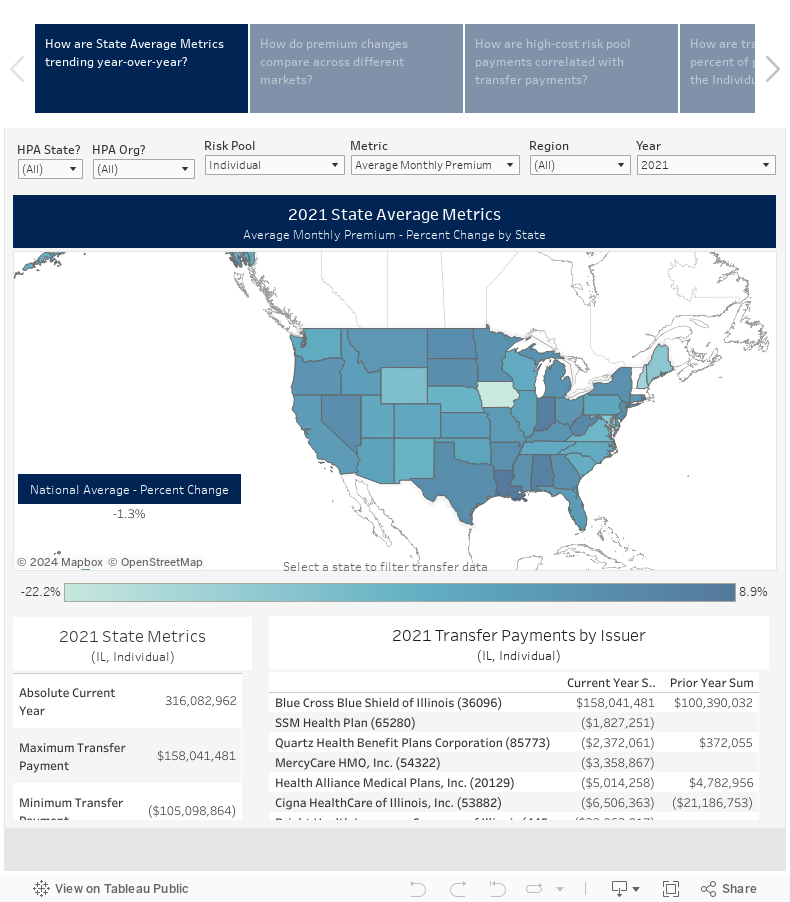
Risk Adjustment Transfer Payments
In the dashboard, use the buttons across the top to navigate the analyses answering key questions, such as:
- How are state average metrics trending year-over-year?
- How do premium changes compare across different markets (by state)?
- How are high-cost risk pool payments correlated with transfer payments?
- How are transfer payments as a percent of premium changing in the Individual and Small Group market?
- What types of plans are capturing transfer payments (e.g., Nationals, Blues Plans, Provider-Sponsored)?
- How did transfer payments change year-over-year by issuer?
Within each view, filter by year, state/region, metric, and/or risk pool/product (Individual or Small Group market) in the drop-downs at the top.
Note: State average Plan Liability Risk Score (PLRS) cannot be compared YOY due to adjustments to the CMS-HHS risk adjustment model coefficients. For this reason, Pareto has applied a reduction to all prior year state average PLRS numbers in the analysis below, allowing for a more accurate YOY comparison.
Conclusion
The above analysis summarizes the HHS data to provide initial insight into the 2021 ACA risk adjustment transfer payment results.
We’re dedicated to helping organizations grow, perform, and transform through professional consultancy and technology-based solutions. Contact us to learn more.