Preliminary Analysis of ACA Risk Adjustment Transfer Payments for 2017
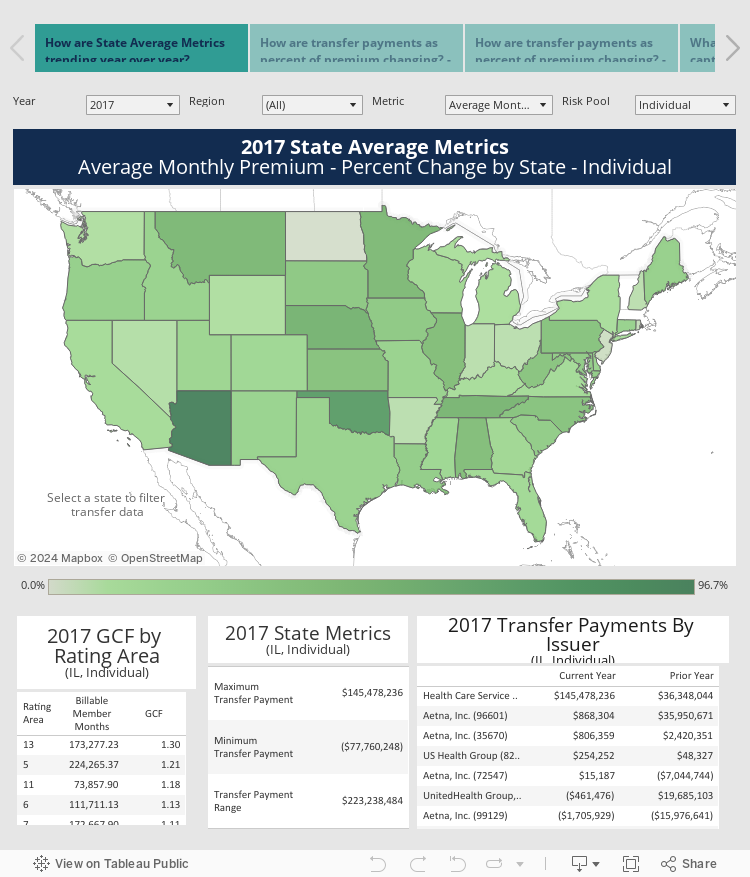
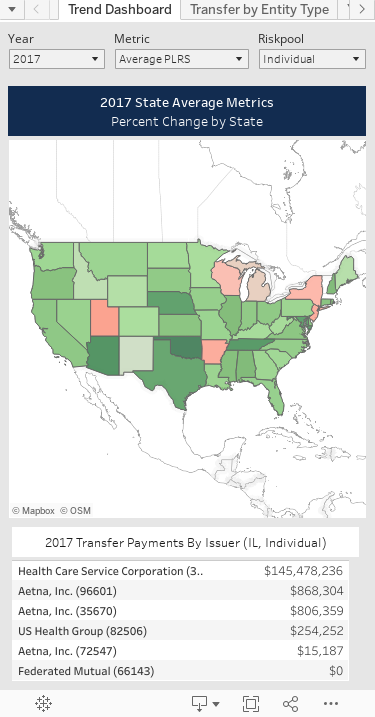
On July 9th, 2018, the Department of Health and Human Services (HHS) released the Summary Report on Risk Adjustment Transfers for the 2017 Benefit Year. This report outlines risk adjustment transfers by issuer and state. The interactive dashboards below provide initial insight and allow for year-over-year comparisons. This post will be followed by an in-depth analysis of the 2017 ACA transfer payments and market trends.
The report released by CMS contains the following note that all payments and collections are on hold due to litigation in New Mexico -
“On February 28, 2018, the United States District Court for the District of New Mexico issued a decision invalidating CMS’s use of the statewide average premium in the risk adjustment transfer formula for the 2014 – 2018 benefit years pending further explanation of CMS’s reasons for operating the risk adjustment program in a budget neutral manner in those years. The government has moved the court to reconsider its decision and CMS is currently awaiting the court’s ruling. In light of the current status of the litigation, the Centers for Medicare & Medicaid Services (CMS) will not collect or pay the specified amounts. CMS will inform stakeholders of any update to the status of collections or payments at an appropriate future date. Additional guidance will be issued in the near future regarding 2017 benefit year appeals and reporting of risk adjustment transfer amounts by issuers for medical loss ratio (MLR) purposes.”
Note: State average PLRS cannot be compared year-over-year due to adjustments to the CMS-HHS risk adjustment model coefficients. For this reason, Pareto has applied a reduction to all Prior Year State Average PLRS numbers in the analysis below, allowing for a more accurate year-over-year comparison.