
New Plans on the Block: What to Expect from the MA Competitive Landscape in 2018
Earlier this month, the Centers for Medicare and Medicaid Services (“CMS”) released the 2018 Medicare Advantage (“MA”) Landscape Files, providing insight into detailed product information for plan benefit packages (“PBPs”) down to the county level. CMS also released PBP Benefits Data, which contains over 50 files of highly specific benefit designs for all services covered by MA plans.
Pareto Spotlight
To help Medicare Advantage Organizations (“MAOs”) interpret this data, Pareto Intelligence, leveraging our MA Market Spotlight solution, quickly ingested these files and conducted an analysis to uncover key considerations for future strategic decision making. Below are some of those takeaways.
(Note: All analyses and insights outlined are limited to Individual, non-SNP, non-PDP products.)
What are the national trends?
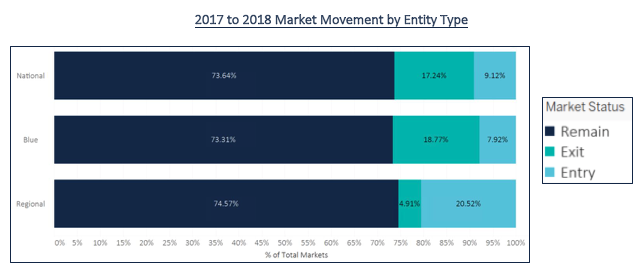
An analysis at the national level sheds light on the how National players, Blues plans, and Regional players approached product decisions for 2018. As shown in the figure below, both Nationals and Blues plans are exiting markets at a higher rate than Regional players. Regionals appear to be in a growth mode, entering significantly more markets (and exiting less) than the other two plan types. These movements are in stark contrast to last year’s action, when all three entity types remained in 90% or more of total markets. This year, we are seeing much higher churn, with regionals becoming more active through market entry compared to last year.
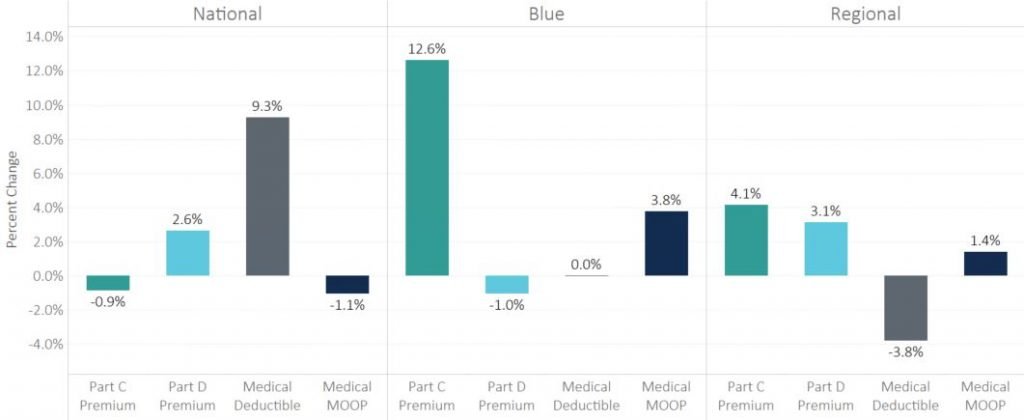
Looking at the major benefit categories in the next figure for retained products, all three entity types vary widely in their approach to pricing strategies. Blues plans in general are increasing Part C premiums and slightly reducing Part D premiums, which may be an adjustment to last year’s sizable increase to Part D premiums. The Nationals are not adjusting premiums much but increasing deductibles on average 9.3%. Although the results vary significantly on a regional level, the national trends highlight the different strategies applied by MAOs to strategically improve competitive position.
Year-Over-Year Benefit Changes by Entity Type
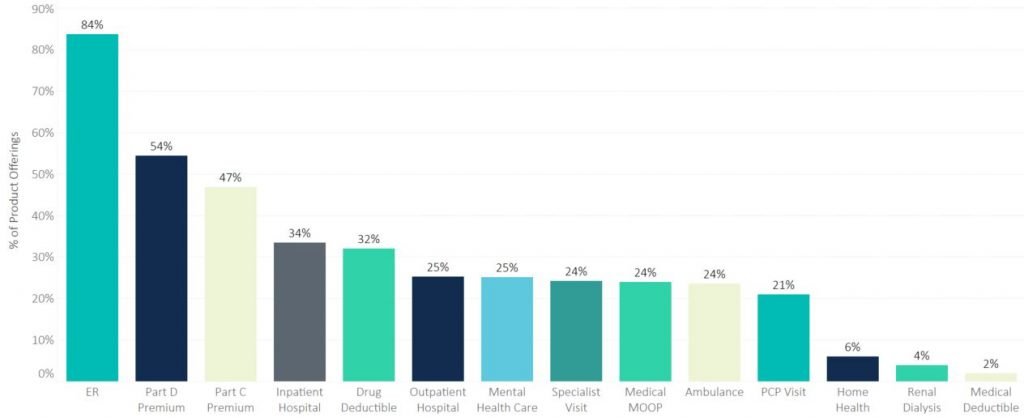
Pareto’s final analysis at the national level details the percent of PBPs that made adjustments to each of the major benefits categories. ER was the most commonly tweaked benefit for 2018; however, this is likely due to the change made by CMS earlier this year that increased the allowed ER copay from $75 to $100 for plans with voluntary MOOP and from $75 to $80 for mandatory MOOP. For reference, only 5% of PBPs made changes to the ER benefit last year, highlighting how responsive plans are to regulatory changes to benefit limits.
Part D premiums also changed for more than half of all PBPs, mostly driven by National and Regional plans as shown by the graph above. In contrast, changes made in nearly half of all PBPs to Part C premiums are driven by Blues and some Regional plans. The remaining benefits were likely changed in an effort to influence member behavior by managing utilization and steering members to certain care settings. While some generalizations can be made, an analysis of the unique nuances of the products offered in the counties that you play in will be key to setting future strategies.
Percent of Products Changed by Benefit Type
What’s happening at a state level?
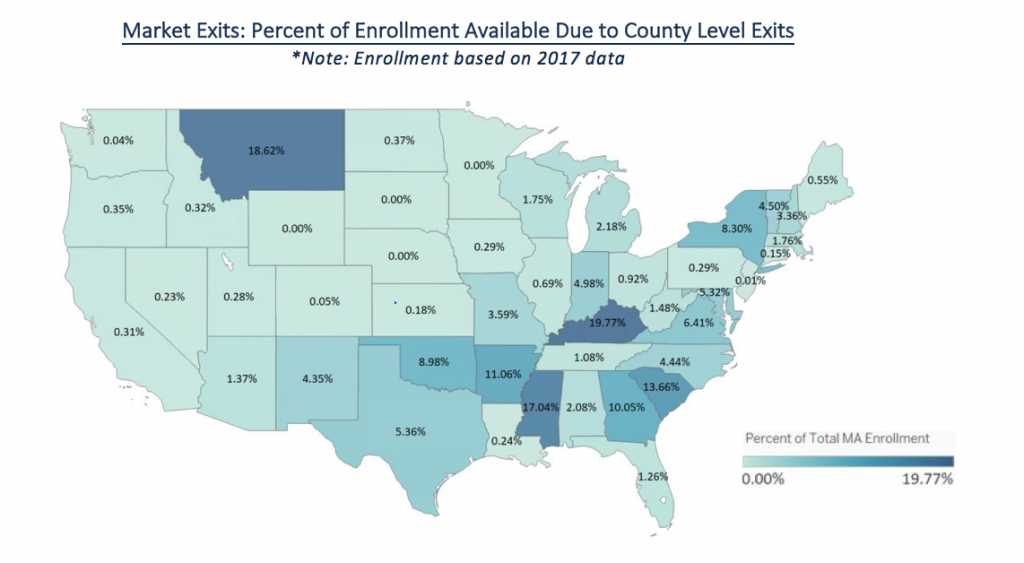
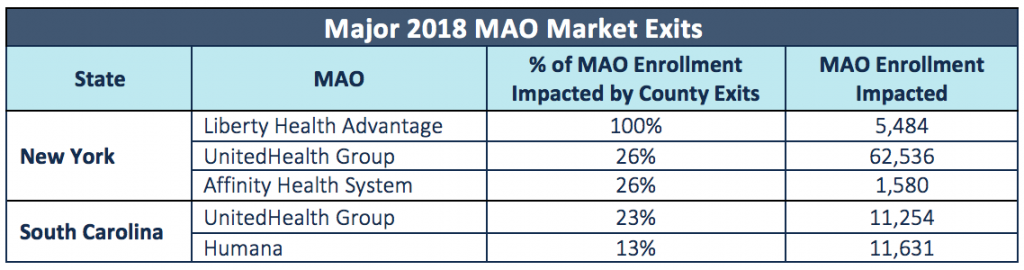
By examining county exits/entries, we identified which states are experiencing the most volatility, and drew conclusions on how MAOs should modify their strategies in response. For example, the states where a disproportionately high number of MAOs exited counties—particularly from markets with high enrollment—may present opportunity as more market share becomes available for capture. MAOs may double down on marketing to acquire these members or choose to enter these markets in future years. This is shown in the figure below, which displays the percentage of the total MA enrolled population in the state that no longer has any product from their 2017 MAO available in their county in 2018.
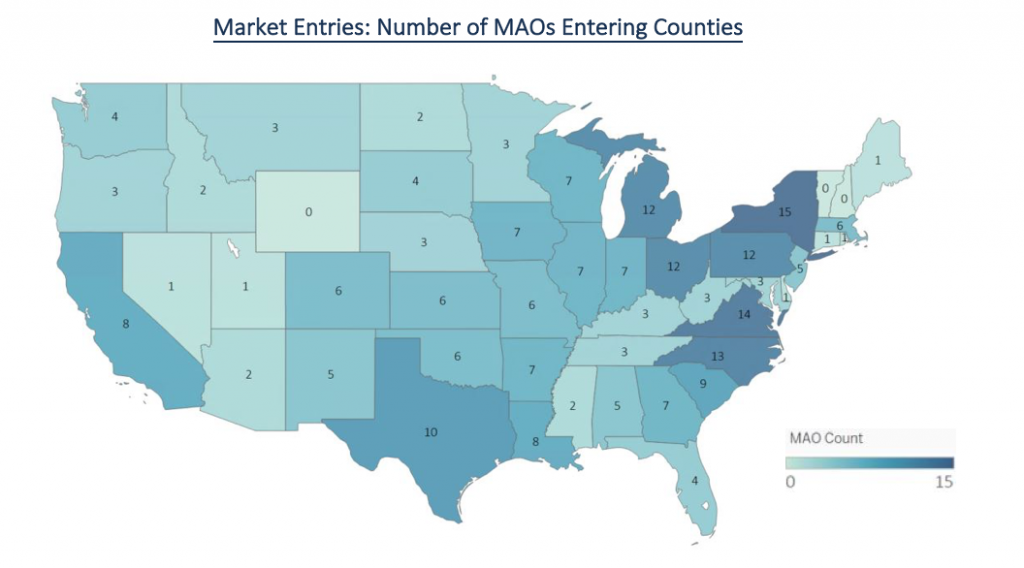
While county exits tell one side of the story, county entries tell the other. The figure below shows the number of MAOs that are entering new counties within each state. As you can see, New York, Virginia and North Carolina were the states with the most county entries, either new MAO entrants into the state or county level expansion of current MAOs. Compared to enrollment percentages available due to county exits, New York has high volatility with 8.3% of the total MA population dropped from their MAO and 15 MAOs entering new counties in 2018.
How do regional market dynamics differ?
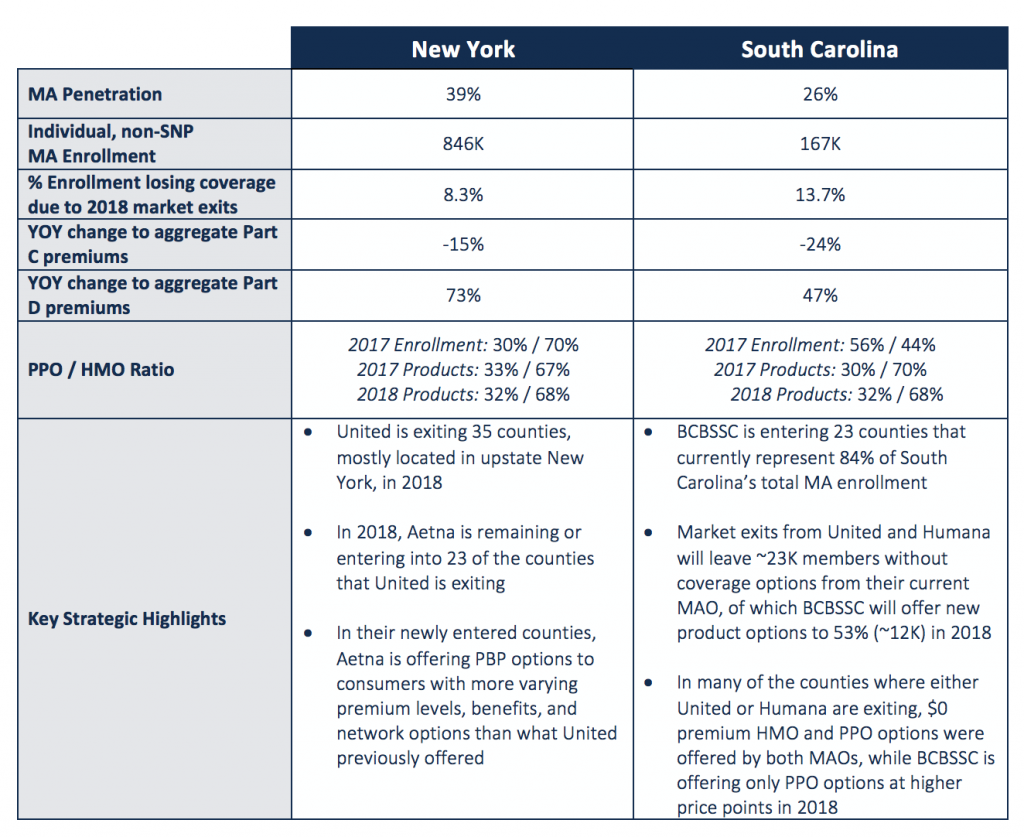
An evaluation of two active markets, New York and South Carolina, begins to highlight that each state, and the local markets within each, are unique and require very different strategies to serve the population and compete competitively versus other MAOs.
Market Movement
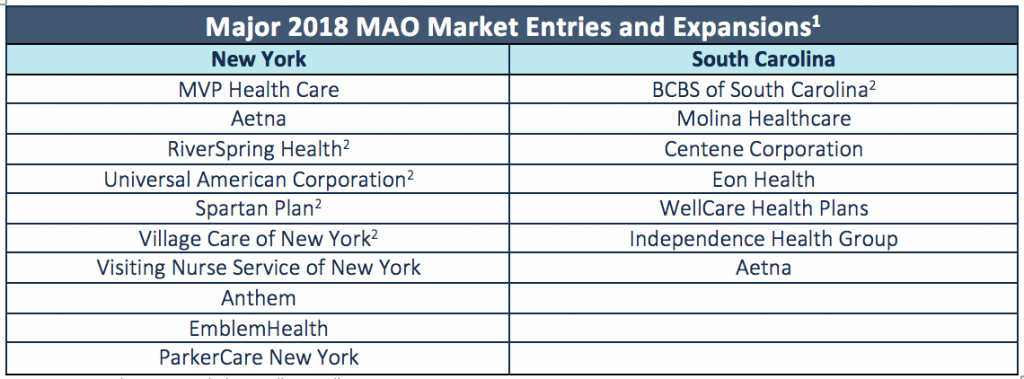
- List not exhaustive, excludes smaller enrollment MAOs
- New State entrant, all others are currently in the state and expanding service area in 2018.
What should MAOs do next?
Assess the Micro-Market Competitive Landscape: As illustrated above with New York and South Carolina, each state and county market exhibits unique competitive landscapes and trends. With an ever-changing competitive landscape, plans need to strategically anticipate and evaluate competitor actions to shield against future challenges and uncover new opportunities. The development of new markets or changes to offerings in current markets in response to competitor movements at the county level are key decisions that a plan’s market, strategy, and product teams must make as they prepare for 2019.
Understand Regional Economic Performance: Evaluating economic performance and the levers that drive it at a regional and county level should factor into market participation decisions. Plans’ market and strategic teams should look for growth strategies in regions with strong indicators of success (positive financial performance, favorable competitive dynamics, effective provider partners, etc.). Conversely, these teams should also review difficult decisions to right-size the MA book by exiting markets that may not be conducive to success (such as markets without a critical mass of current Medicare eligibles or age-in prospects, or markets without provider partners that effectively manage the risk of the MA population).
Identify Impactable Cost & Utilization Trends: Network, premiums, other top-line product design features (e.g., MOOP and deductibles), and formulary are the primary drivers of the consumer purchase decision, but member cost-sharing for detailed service line benefits—if set appropriately—can incentivize behavior and drive patients to the right care settings. The impact of product benefit design on cost and utilization outcomes should inform strategic 2019 product design decisions that positively influence performance.
Pareto Market Spotlight: This analysis was informed by our Market Spotlight solution, a tool that is part of our Risk Economics platform. Market Spotlight applies advanced analytics to over 300 disparate third party datasets annually to generate a holistic view of performance and the MA competitive landscape at the national, state and county level. Contact us for more information on how you can get immediate access to this valuable information and tool for your markets.