
Insight
02.16.18
2018 Medicare Advantage Annual Enrollment Period Analysis
The data used to populate the 2018 Medicare Advantage Annual Enrollment Period (AEP) Analysis was automatically aggregated using the Pareto Spotlight solution, using the final AEP results data released by CMS on February 15, 2018.
Pareto Spotlight
Current Pareto Spotlight subscribers can use this link to log in and pull further insights from the 2018 Medicare Advantage AEP Results, including county-level and product-feature level results. If you are not a subscriber and would like to learn more about the Pareto Spotlight solution, please contact Brandon Solomon at bsolomon@paretointel.com.
Key Takeaways:
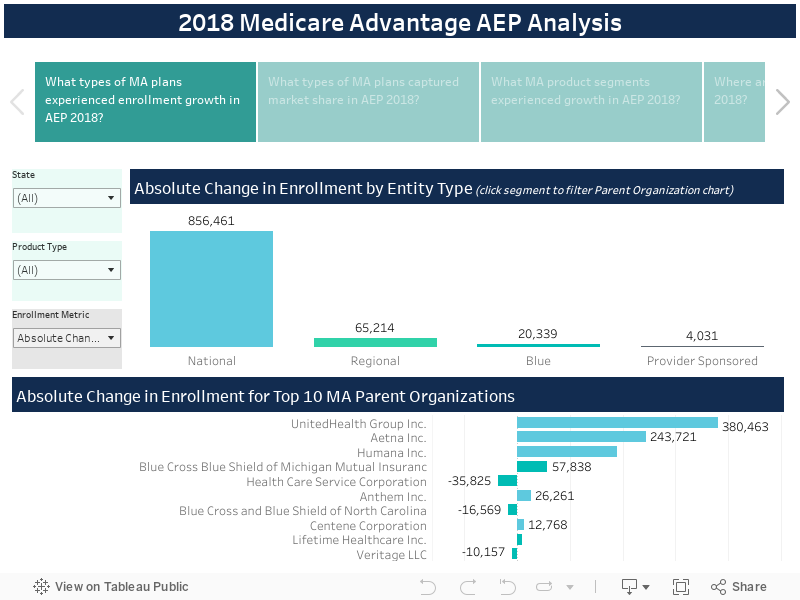
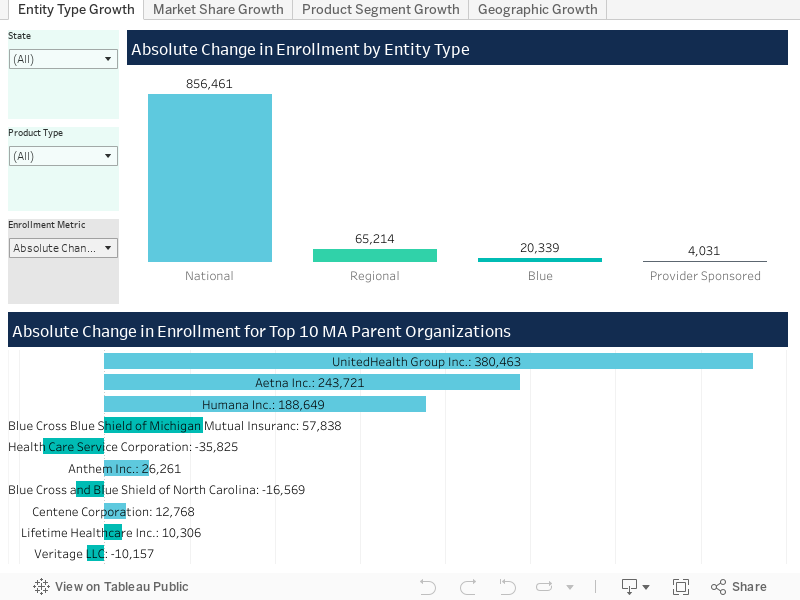
- National plans continue to grab market share, with 850,000+ new enrollees in 2018. Enrollment growth within these plans is not universal, however, with United (7.85% growth) and Aetna (16.49% growth) leading the way while Anthem (3.78% growth) and Kaiser (0.33% growth) lag behind.
- Provider-sponsored and Blues plans especially struggled to attract new enrollment, with growth of 0.19% and 0.81% respectively.
- The distribution of market share by product type (network and segment combination) was relatively stable, with the exception of EGHP PPO which captured an additional 1.37% in market share. This growth was fueled by increases in enrollment for Aetna (160K), United (150K), and BlueCross BlueShield of Michigan (54K).
- PPO (4.10%) and HMO (4.00%) products grew at very similar rates in the Individual market, but with HMO products having substantially more enrollment overall (9.8M to 3.6M).
- Market growth by geography varied wildly with states like Michigan (10.88%) and Texas (9.15%) growing substantially while some rural, Western states like Montana (-11.40%) and South Dakota (1.30%) lost enrollment or grew slowly.