
Hidden Figures: 2016 ACA Risk Adjustment Individual Market Results
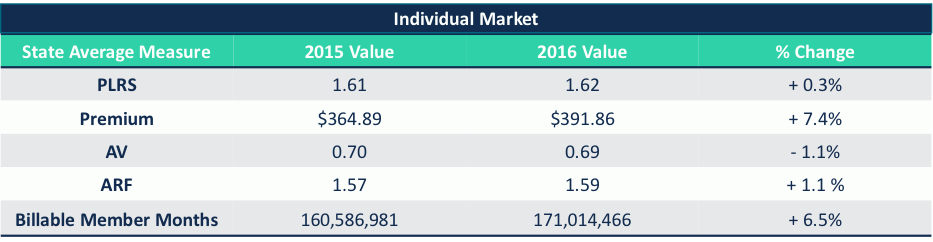
On June 30, 2017, HHS released the Summary Report on Transitional Reinsurance Payments and Permanent Risk Adjustment Transfers for the 2016 Benefit Year. This report outlines risk adjustment transfers and reinsurance payment amounts by issuer and state. In general, the overarching themes were relatively consistent with prior years. For the 2016 benefit year, risk adjustment transfers as a percent of premiums were 11% for the Individual market compared to 10% in 2014 and 2015. On a national level, year-over-year variability in the components of the transfer payment calculation were marginal, with increases to plan liability risk score (PLRS), premiums, allowable rating factor (ARF) and market size, countered by a decrease in actuarial values (AV).
CMS attributes the slight increase in the Individual Market transfer payments as a percent of overall premium to healthy enrollees switching from Platinum and Gold plans to Silver and Bronze plans. This explanation correlates to the reduction in AV nationally, but the explanation for year-over-year changes in transfer payments cannot be told on a national level as state results vary widely.
Significant State Variation in Transfer Payment Results
Transfer payments as a percent of premium varied by state from less than 1% to over 20%. This level of variation is consistent with last year’s results, but what is unique is the year-over-year variability in transfer payments within each state. The graphic on the following page illustrates the state-by-state variability in transfer payments as a percent of premium from 2015 to 2016.
In 2015, Minnesota’s transfer payments as a percentage of overall premiums was 9.2%. It then jumped to 21.5% in 2016, resulting in a 12.3 percentage point increase. Arizona, on the other hand, went from 17.6% in 2015 down to 12.5%, a 5.2 percentage point reduction. Diving deeper into each state generates a potentially unique rationale for their significantly different results in 2016.
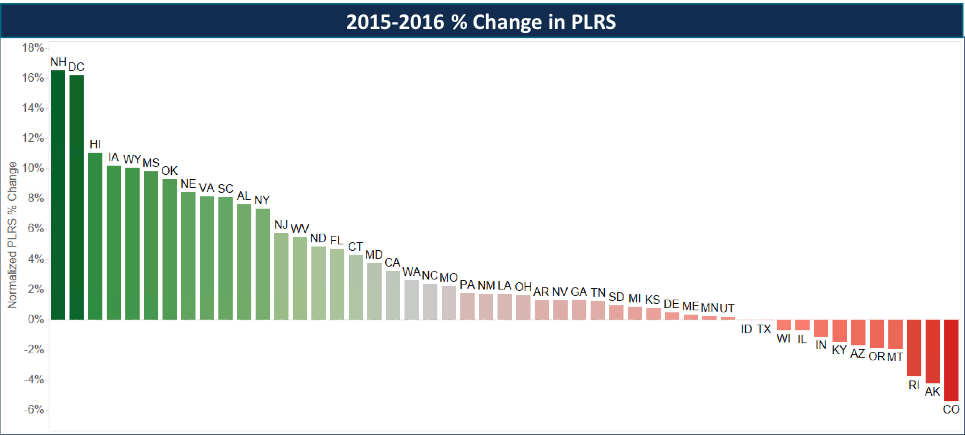
A 2.34% reduction to 2016 PLRS scores was applied to account for the reduction in risk coefficients from 2015 to 2016.
- Minnesota: Significant premium increases may have been a leading contributor to the 14.9% membership reduction in 2016. Though PLRS stayed roughly the same, the significant decrease in AV, which lowers PLRS, indicates that overall membership is actually riskier compared to 2015. The retention of high-risk members amongst a small concentration of issuers, like BCBSMN who saw their transfer payment receipt increase from $29M in 2015 to $110M in 2016, magnifies transfer payments receipts and outflows.
- Arizona: The opposite occurred in the Arizona market where membership increased, but the biggest change was the exit of Meritus Health Partners. Meritus accounted for 70% of the transfer payment payables in 2015 as they attracted a disproportionately healthier risk pool relative to other issuers. Their exit from the market redistributed those members amongst the other issuers, lowering the risk variation between participating issuers and decreasing transfer payments as a percent of premiums.
Every State Market is Unique
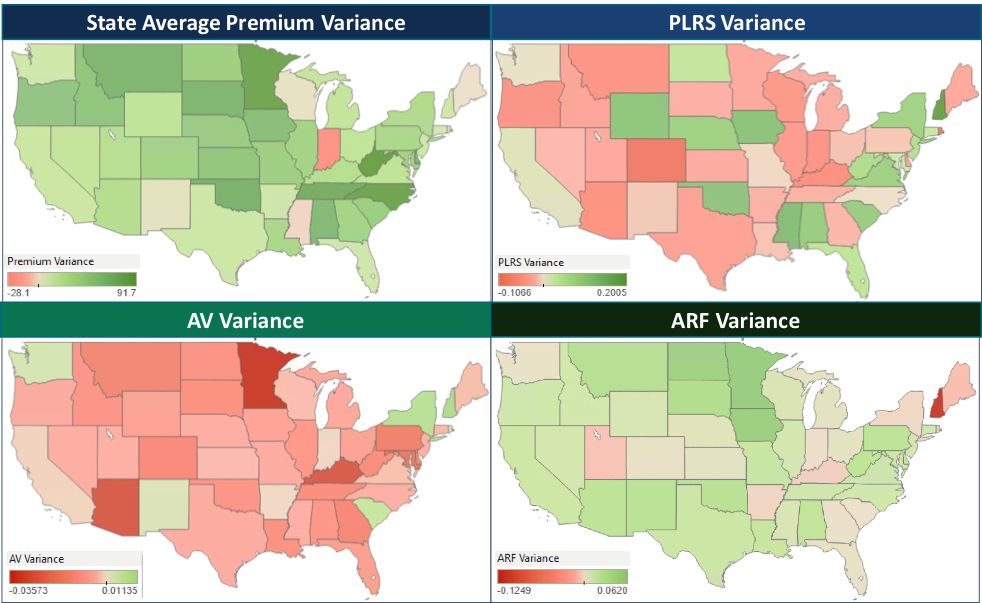
There is significant variation in the components of the transfer payment calculation when evaluated on a state-by-state basis. The combination of which generates a unique explanation on the changes for each state market.
First, we evaluated changes in PLRS from 2015 to 2016, normalizing for the change in the risk model coefficients from 2015 to 2016, which we quantified to have a -2.34% impact on risk scores. The variability from a 5% reduction in Colorado to a 17% increase in New Hampshire has significant implications on transfer payments, but requires further understanding of the other factors that drove such variation.
There were significant changes in the other components of the transfer payment formula, though some common themes did emerge:
- Premiums: Except for Indiana, all states saw an increase in the statewide average premium, though actuarial values, in general, decreased. The intensity of these increases contributes to the inflation in transfer payments by issuers with the number of issuers paying or receiving over $100M more than doubling—from 6 in 2015 to 13 in 2016.
- Billable Member Months: Most states experienced an increase in membership, while some experienced significant changes contributing to heightened variability in year-over-year results.
- Actuarial Value: 43 states experienced a reduction in AV as fewer issuers offered platinum products and the trend of members buying down continued.
- Allowable Rating Factor: An indication of average market age, ARF increased in 42 states, highlighting that the average age in the Individual Market continues to increase.
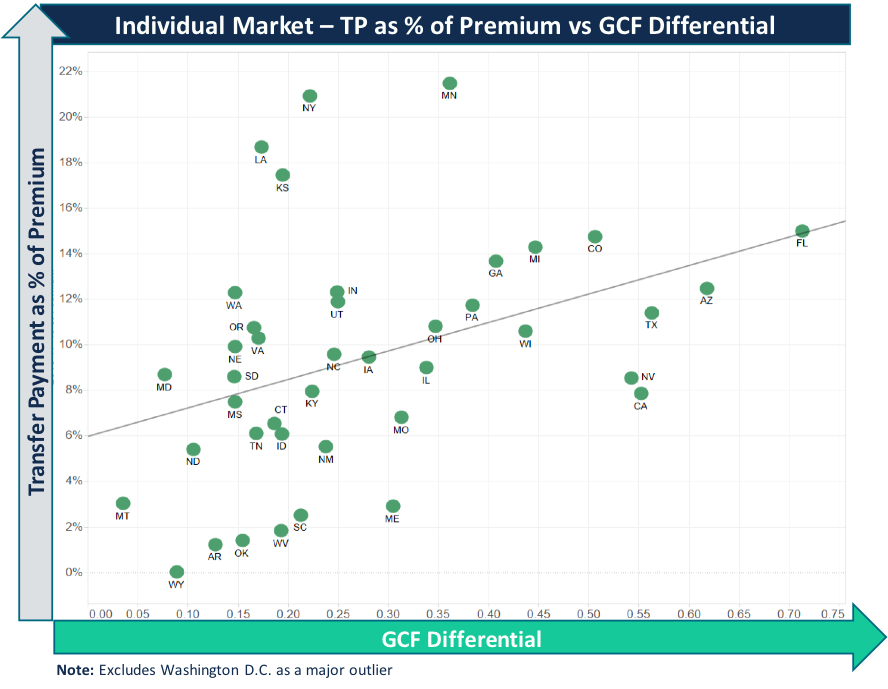
- Geographic Cost Factor: Geographic cost factors, as defined by HHS, are meant to “remove differences in premium due to allowable geographic rating factors.” Significant GCF variation by rating area can have an amplifying effect on transfer payments within a state market when the state has regional issuers, narrow geographic footprints, and sizeable market share. In 2016, 133 rating areas—which encompassed 27% of all rating areas—had GCF change by greater than 5%.
Commercial risk adjustment is complex and has numerous variables that will differ from state to state. Carrier exits, variation in product offerings across a state (PPO, HMO, narrow networks), and geographic cost differences all have an impact on transfer payments and will continue to do so given market instability. What is clear is that risk adjustment continues to be material for the ACA and will likely see more changes as further risk model changes get implemented.
Implications for 2017 and Beyond
Understanding state dynamics is critical to accurate forecasting and setting strategy: The continued volatility of the ACA Individual market requires issuers to understand the year-over-year market dynamics to inform 2017 accruals, determine 2018 participation, and begin to establish 2019 product and pricing strategies.
Understand 2017 and 2018 risk model changes: 2016 is the first year CMS made adjustments to the risk coefficients, but more significant changes are being implemented in 2017 and 2018. Depending on the member mix being served, these changes will have an impact on issuer transfer payments. It is important to have an understanding of one’s “Risk Economics.”
Risk score documentation continues to be important: Ensuring an accurate transfer payment that aligns with the actual risk of an issuer’s enrollees is critical to plan performance. Along with educating providers, executing targeted member outreach tactics and continuing to refine chart chase methodologies are key in documenting an accurate risk profile.
Addressing unreported risk loss: Issuers should ensure their data collection, processing, and reporting procedures yield 100% accuracy and completeness. Degradation of data through dropping of information, truncation, or manipulation from the receipt of billing 837s from providers, to claims processing, and ending with EDGE Server submissions can have a material impact on final PLRS. Many issuers solely focus on ensuring that what is submitted is accepted, but neglect ensuring that everything collected from the provider is being properly submitted.